Apple M4 (10-core GPU, 120 GB/s) vs Intel N150 Mini PC (GMKTek G3 Plus) (as tested by Jeff Geerling)
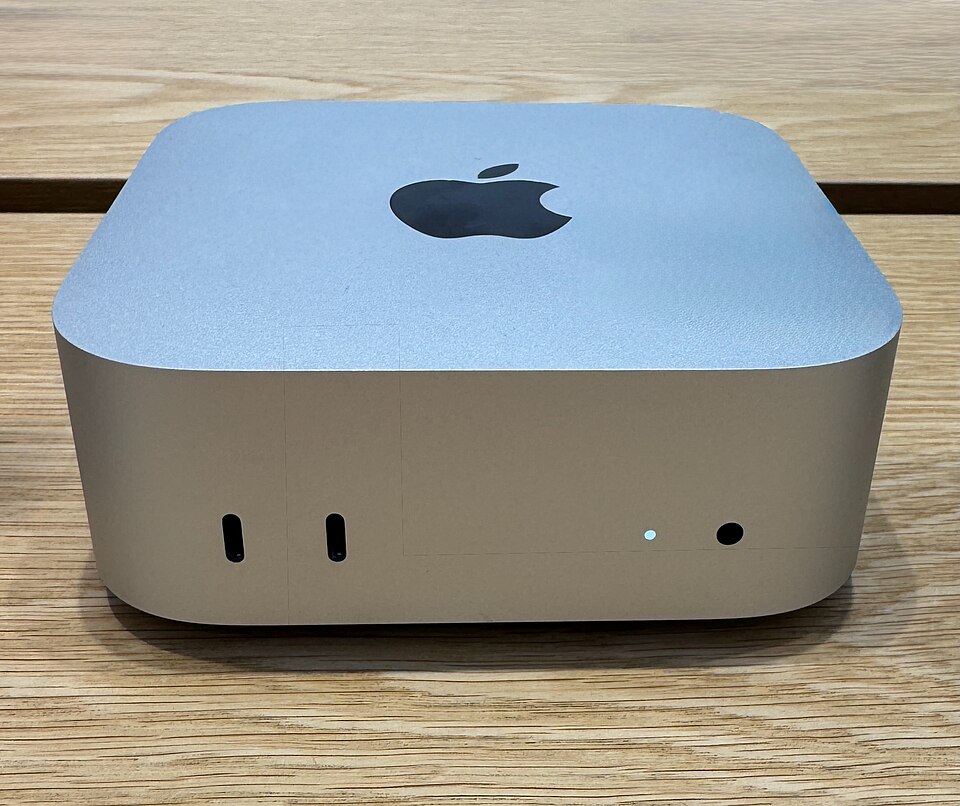

Apple M4 (10-core GPU, 120 GB/s) is faster in all 2 like-for-like comparisons (largest gap: LLM generation, 6.17×).
| Apple M4 (10-core GPU, 120 GB/s) | Intel N150 Mini PC (GMKTek G3 Plus) (as tested by Jeff Geerling) | |
|---|---|---|
| Best LLM generation | 41.31 tok/s C 2026-09-22 (page last edited) | 17.99 tok/s C Older data (2025) |
| Power | 30.10 W ● Measured, Whole system | 29.90 W ● Measured, Whole system |
| Perf / W | 1.37 tok/s/W ● Measured, Whole system | 0.602 tok/s/W ● Measured, Whole system |
| Price | n/a | n/a |
| Workloads with data | 6 of 7 | 1 of 7 |
Best published LLM generation result per platform (may be from different like-for-like groups — see data). n/a = not published; never estimated.
Show data — all workloads, sources and like-for-like groups
object detection
Only Apple M4 (10-core GPU, 120 GB/s) has published object detection results.
| Platform | Result | Model · precision · stack | Grade | Power | Source |
|---|---|---|---|---|---|
| Apple M4 (10-core GPU, 120 GB/s) | 357 FPS latency_e2e · b=1 | YOLO26n FP16 · Ultralytics 8.4.168 Core AI (coreai-torch 0.4.3), macOS 27.0 · nano (YOLO-n) | B | 65.00 W Board TDP, Whole system reported in result source — Board TDP, Whole system | Ultralytics documentation: Apple Core AI integration benchmark 2026-10-01 (page last edited) |
Intel N150 Mini PC (GMKTek G3 Plus) (as tested by Jeff Geerling):
No published object detection results for Intel N150 Mini PC (GMKTek G3 Plus) (as tested by Jeff Geerling) or Apple M4 (10-core GPU, 120 GB/s) yet.
We only show cited public figures — nothing is estimated to fill gaps. Requests tell us what to source or test next.
instance segmentation
Only Apple M4 (10-core GPU, 120 GB/s) has published instance segmentation results.
| Platform | Result | Model · precision · stack | Grade | Power | Source |
|---|---|---|---|---|---|
| Apple M4 (10-core GPU, 120 GB/s) | 196 FPS latency_e2e · b=1 | YOLO26n-seg FP16 · Ultralytics 8.4.168 Core AI (coreai-torch 0.4.3), macOS 27.0 · nano (YOLO-n) | B | 65.00 W Board TDP, Whole system reported in result source — Board TDP, Whole system | Ultralytics documentation: Apple Core AI integration benchmark 2026-10-01 (page last edited) |
Intel N150 Mini PC (GMKTek G3 Plus) (as tested by Jeff Geerling):
No published instance segmentation results for Intel N150 Mini PC (GMKTek G3 Plus) (as tested by Jeff Geerling) or Apple M4 (10-core GPU, 120 GB/s) yet.
We only show cited public figures — nothing is estimated to fill gaps. Requests tell us what to source or test next.
pose estimation
Only Apple M4 (10-core GPU, 120 GB/s) has published pose estimation results.
| Platform | Result | Model · precision · stack | Grade | Power | Source |
|---|---|---|---|---|---|
| Apple M4 (10-core GPU, 120 GB/s) | 370 FPS latency_e2e · b=1 | YOLO26n-pose FP16 · Ultralytics 8.4.168 Core AI (coreai-torch 0.4.3), macOS 27.0 · nano (YOLO-n) | B | 65.00 W Board TDP, Whole system reported in result source — Board TDP, Whole system | Ultralytics documentation: Apple Core AI integration benchmark 2026-10-01 (page last edited) |
Intel N150 Mini PC (GMKTek G3 Plus) (as tested by Jeff Geerling):
No published pose estimation results for Intel N150 Mini PC (GMKTek G3 Plus) (as tested by Jeff Geerling) or Apple M4 (10-core GPU, 120 GB/s) yet.
We only show cited public figures — nothing is estimated to fill gaps. Requests tell us what to source or test next.
image classification
Only Apple M4 (10-core GPU, 120 GB/s) has published image classification results.
| Platform | Result | Model · precision · stack | Grade | Power | Source |
|---|---|---|---|---|---|
| Apple M4 (10-core GPU, 120 GB/s) | 417 FPS latency_e2e · b=1 | YOLO26n-cls FP16 · Ultralytics 8.4.168 Core AI (coreai-torch 0.4.3), macOS 27.0 · nano (YOLO-n) | B | 65.00 W Board TDP, Whole system reported in result source — Board TDP, Whole system | Ultralytics documentation: Apple Core AI integration benchmark 2026-10-01 (page last edited) |
Intel N150 Mini PC (GMKTek G3 Plus) (as tested by Jeff Geerling):
No published image classification results for Intel N150 Mini PC (GMKTek G3 Plus) (as tested by Jeff Geerling) or Apple M4 (10-core GPU, 120 GB/s) yet.
We only show cited public figures — nothing is estimated to fill gaps. Requests tell us what to source or test next.
semantic segmentation
Only Apple M4 (10-core GPU, 120 GB/s) has published semantic segmentation results.
| Platform | Result | Model · precision · stack | Grade | Power | Source |
|---|---|---|---|---|---|
| Apple M4 (10-core GPU, 120 GB/s) | 53.48 FPS latency_e2e · b=1 | YOLO26n-sem FP16 · Ultralytics 8.4.168 Core AI (coreai-torch 0.4.3), macOS 27.0 · nano (YOLO-n) | B | 65.00 W Board TDP, Whole system reported in result source — Board TDP, Whole system | Ultralytics documentation: Apple Core AI integration benchmark 2026-10-01 (page last edited) |
Intel N150 Mini PC (GMKTek G3 Plus) (as tested by Jeff Geerling):
No published semantic segmentation results for Intel N150 Mini PC (GMKTek G3 Plus) (as tested by Jeff Geerling) or Apple M4 (10-core GPU, 120 GB/s) yet.
We only show cited public figures — nothing is estimated to fill gaps. Requests tell us what to source or test next.
speech-to-text
No published speech-to-text results for Apple M4 (10-core GPU, 120 GB/s) or Intel N150 Mini PC (GMKTek G3 Plus) (as tested by Jeff Geerling) yet.
We only show cited public figures — nothing is estimated to fill gaps. Requests tell us what to source or test next.
LLM generation
| Platform | Result | Model · precision · stack | Grade | Power | Source |
|---|---|---|---|---|---|
| Apple M4 (10-core GPU, 120 GB/s) | 24.11 tok/s tg128 · b=1 | Llama 2 7B Q4_0 · llama.cpp Metal (commit 8e672ef) · LLM 5–14B | C | unknown power not published not published | llama.cpp discussion #4167 scoreboard (via GitHub API) 2026-10-01 (page last edited) |
| Intel N150 Mini PC (GMKTek G3 Plus) (as tested by Jeff Geerling) | 3.91 tok/s generation_throughput · b=1 | llama3.1:8b Ollama default tag (4-bit unless tag says otherwise) · Ollama (geerlingguy/ollama-benchmark) · LLM 5–14B | C | 29.80 W ● Measured, Whole system reported in result source — Measured, Whole system | Jeff Geerling ai-benchmarks issue results (comments) Older data (2025) |
| Platform | Result | Model · precision · stack | Grade | Power | Source |
|---|---|---|---|---|---|
| Apple M4 (10-core GPU, 120 GB/s) | 41.31 tok/s generation_throughput · b=1 | Llama 3.2:3b as in linked issue (Ollama default tags are 4-bit) · Ollama / llama.cpp (see linked issue) · LLM ≤4B | C | 30.10 W ● Measured, Whole system reported in result source — Measured, Whole system | Jeff Geerling ai-benchmarks README (Findings tables) 2026-09-22 (page last edited) |
| Intel N150 Mini PC (GMKTek G3 Plus) (as tested by Jeff Geerling) | 17.99 tok/s generation_throughput · b=1 | deepseek-r1:1.5b Ollama default tag (4-bit unless tag says otherwise) · Ollama (geerlingguy/ollama-benchmark) · LLM ≤4B | C | 29.90 W ● Measured, Whole system reported in result source — Measured, Whole system | Jeff Geerling ai-benchmarks issue results (comments) Older data (2025) |
Grades: A audited MLPerf · B third-party · C community · D vendor. How we rank · JSON